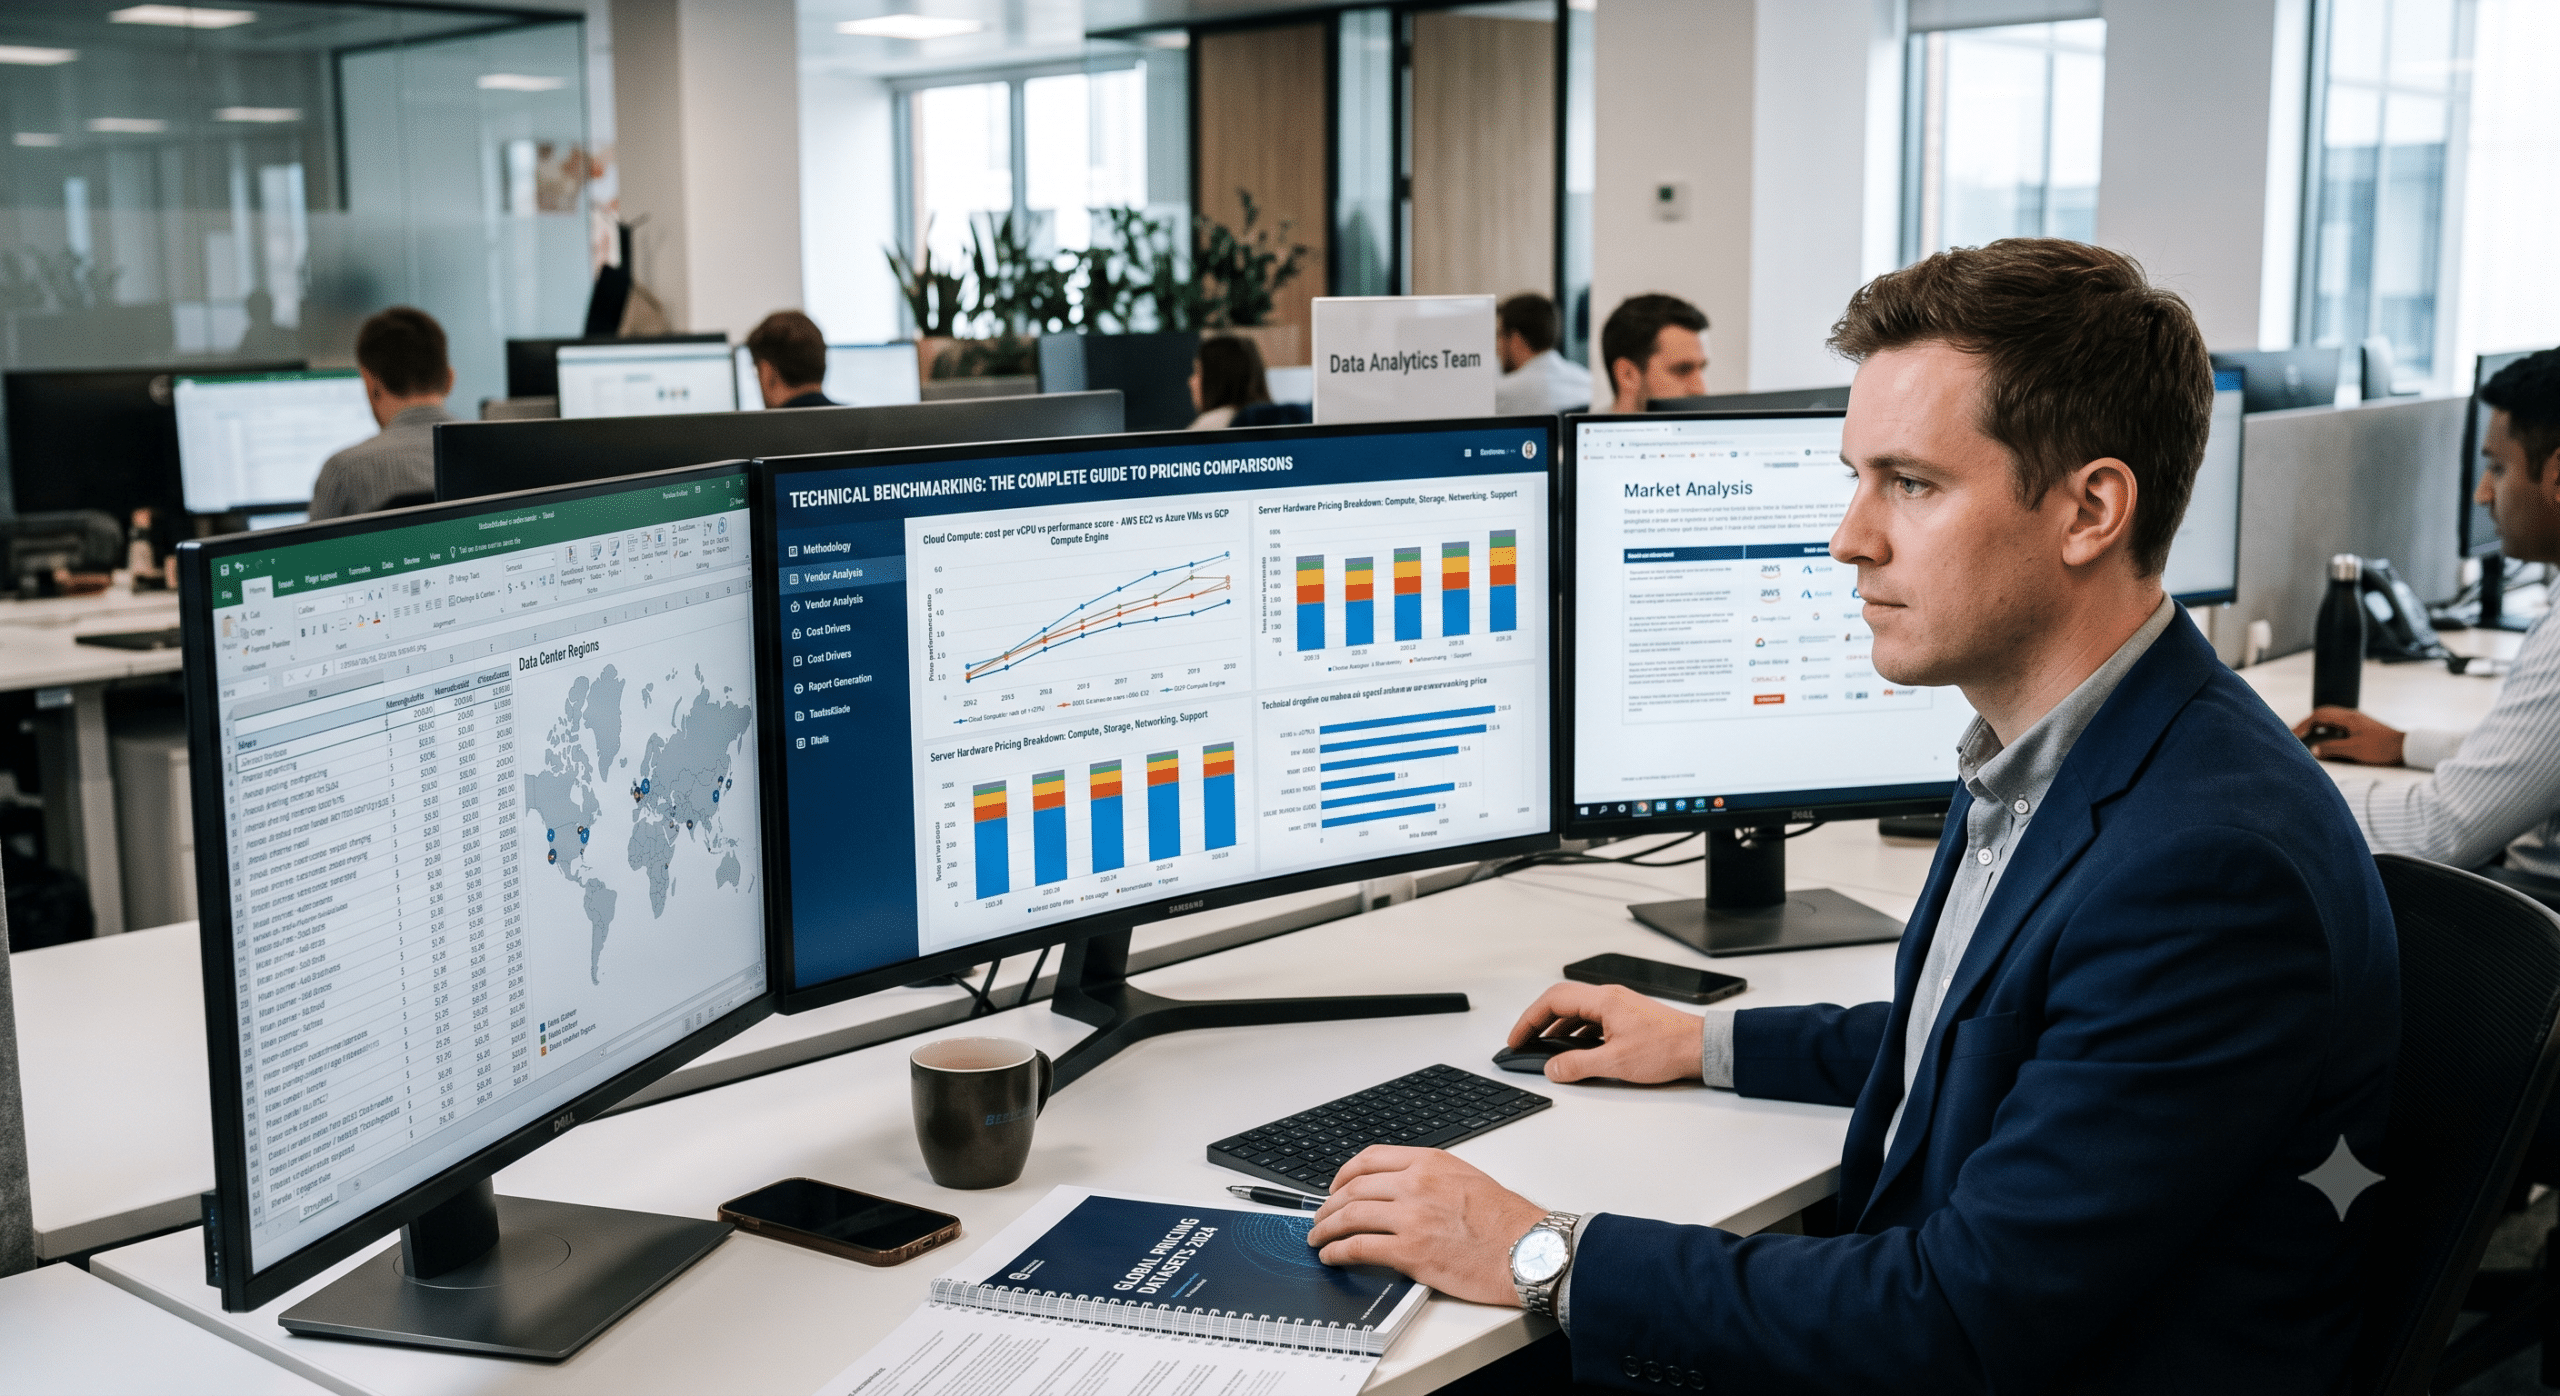
When engineering teams evaluate software and infrastructure, performing thorough technical pricing comparisons is critical to answering one essential question: Are we paying the right price for the tools we use?
As a Benchmarking Engineer, I’ve learned that pricing alone rarely tells the full story. In fact, a tool that costs less today may become much more expensive after deployment because of slower performance, higher maintenance, additional infrastructure, or licensing limitations. On the other hand, a premium-priced solution can actually reduce overall operating costs if it improves efficiency and reliability.
For this reason, conducting technical pricing comparisons is an essential part of software evaluation and engineering management. Instead of simply comparing subscription fees, engineers evaluate cost alongside measurable performance indicators. Ultimately, the goal is to understand the complete value delivered over the lifetime of a product.
Many organizations make purchasing decisions based purely on feature lists or marketing presentations. While these materials are useful, they often overlook measurable data collected through rigorous benchmarking. Consequently, real-world testing provides objective evidence that helps engineering teams, procurement departments, and business leaders make confident investments.
In this comprehensive guide, I’ll explain how benchmarking engineers perform technical pricing comparisons, what metrics matter most, common mistakes to avoid, and finally, how to build an evaluation framework that leads to smarter technical decisions.
What Are Pricing Comparisons?
In technical procurement, pricing comparisons are the systematic process of evaluating multiple products or services based on their total cost and measurable value. Unlike simple price shopping, technical pricing comparisons account for a wide range of operational factors. Specifically, these factors include:
-
Purchase price
-
Subscription costs
-
Licensing model
-
Infrastructure expenses
-
Performance efficiency
-
Maintenance costs
-
Scalability
-
Operational overhead
To illustrate this, imagine comparing two monitoring platforms:
| Factor | Tool A | Tool B |
| Annual License | Lower | Higher |
| Server Resources | High | Low |
| Support Included | No | Yes |
| Downtime | More Frequent | Rare |
| Upgrade Cost | Extra | Included |
At first glance, Tool A appears cheaper. However, after benchmarking real workloads, Tool B may actually save thousands of dollars every year because it consumes fewer computing resources and requires far less maintenance. This is precisely why professional benchmarking always measures long-term value instead of price alone.
Why Benchmarking Engineers Focus on Pricing Comparisons
Performance engineers understand something many buyers overlook: the cheapest software isn’t always the least expensive solution.
Therefore, conducting technical pricing comparisons helps answer critical operational questions, such as:
-
Does better performance justify higher licensing costs?
-
Furthermore, will additional automation significantly reduce labor costs?
-
Additionally, how much infrastructure is actually required?
-
Moreover, how much costly downtime can be avoided?
-
Finally, does premium support reduce operational risks?
In essence, benchmarking converts these vague questions into measurable, data-driven results. As a result, instead of relying on subjective opinions, engineering teams depend on data collected through repeatable testing. Ultimately, this data-backed approach reduces costly purchasing mistakes and thus helps organizations maximize technology investments.
The Difference Between Price and Cost
One of the biggest misconceptions in technology procurement is treating price and cost as if they mean the exact same thing. To put it clearly, they do not.
Price
Price is simply what you pay to purchase or subscribe to a product initially. For instance, consider these common pricing points:
-
$500 monthly subscription
-
$20,000 enterprise license
-
$99 developer plan
However, these numbers represent only the starting point of your overall financial commitment.
Cost
Cost, on the other hand, includes everything associated with operating the solution over time. For example, cost encompasses:
-
Cloud hosting and storage
-
CPU consumption and memory usage
-
Network bandwidth
-
Ongoing maintenance and employee training
-
Vendor support and upgrades
-
Unexpected downtime
Because of this crucial distinction, engineers rely on technical pricing comparisons to evaluate Total Cost of Ownership (TCO) rather than relying solely on the baseline purchase price.
The 8 Factors Every Pricing Comparison Should Measure
Professional benchmarking looks far beyond monthly subscription fees. Specifically, here are the eight most important categories engineers evaluate when conducting technical pricing comparisons:
1. Initial Purchase Cost
This category includes licensing, setup fees, activation, installation, and consulting costs. Indeed, some enterprise products have surprisingly low subscription fees but very high onboarding costs. Therefore, benchmarking documents every single initial expense upfront.
2. Infrastructure Requirements
Performance testing reveals how much infrastructure each product needs. Specifically, key metrics include:
-
CPU utilization
-
Memory consumption
-
Storage growth
-
Network traffic
Furthermore, a solution requiring twice as many cloud servers can dramatically increase operational expenses. Thus, infrastructure benchmarking often uncovers hidden expenses long before deployment occurs.
3. Performance Efficiency
Performance directly affects operational costs. To demonstrate, consider two competing databases:
-
Database A processes 100 transactions per second.
-
Database B processes 500 transactions per second.
Even if Database B costs more initially, it may eliminate the need for additional servers, thereby creating significant savings over time.
4. Scalability
Some platforms perform well with small workloads but become prohibitively expensive as demand grows. Accordingly, benchmarking measures performance under an increasing load. For instance, typical scalability tests evaluate performance across:
-
100 users
-
500 users
-
1,000 users
-
5,000 users
-
10,000 users
Consequently, these tests reveal exactly how pricing changes as the organization expands.
5. Maintenance Requirements
Maintenance has a direct, measurable financial impact. In this category, key questions include:
-
How often are updates required?
-
Additionally, how much planned downtime occurs?
-
Furthermore, how many administrators are needed?
-
Lastly, is manual optimization required?
In many cases, lower maintenance demands easily offset higher initial licensing costs.
6. Vendor Support
Support quality directly affects team productivity. To evaluate vendor support properly, benchmarking teams analyze:
-
Response times and resolution speed
-
Documentation quality
-
Community resources and training availability
Ultimately, reliable support minimizes operational delays and reduces team frustration.
7. Reliability
Unexpected outages create substantial financial losses. Because of this, benchmarking carefully measures:
-
System availability and failure rates
-
Recovery times
-
Stability during peak workloads
In short, a slightly higher-priced solution with superior reliability often provides greater long-term value.
8. Long-Term Value
Finally, engineers consider the broader, overall business value. For instance, they consider:
-
Will this solution remain useful in five years?
-
Besides that, can it integrate easily with future systems?
-
Additionally, does it support automated workflows?
-
Alternatively, will future upgrades require a full replacement?
As a result, long-term benchmarking prevents expensive system migrations later down the road.
Why Total Cost of Ownership (TCO) Matters
Total Cost of Ownership (TCO) provides a much more realistic financial picture than simply comparing license prices. In practice, a complete TCO calculation includes:
-
Purchase cost and subscription fees
-
Infrastructure and security expenses
-
Staff training and ongoing maintenance
-
Downtime, support, power consumption, and disaster recovery
Without proper benchmarking, many of these costs remain hidden until well after deployment. Conversely, organizations that incorporate technical pricing comparisons prior to purchasing typically make far more informed, sustainable investments.
How Benchmarking Produces Objective Pricing Comparisons
Marketing materials naturally highlight product strengths while minimizing limitations. In contrast, technical benchmarking eliminates assumptions. Instead of relying on vendor claims, engineers collect raw, measurable data.
For example, typical benchmarking activities include:
-
Load and stress testing
-
Performance monitoring and capacity testing
-
Resource utilization analysis and response time measurement
-
Failure testing and financial cost modeling
Consequently, the resulting reports help decision-makers complete thorough technical pricing comparisons using consistent, objective evaluation criteria rather than subjective opinions.
Common Pricing Models Engineers Compare
Different vendors structure pricing in fundamentally different ways. Therefore, understanding these models is essential when executing technical pricing comparisons.
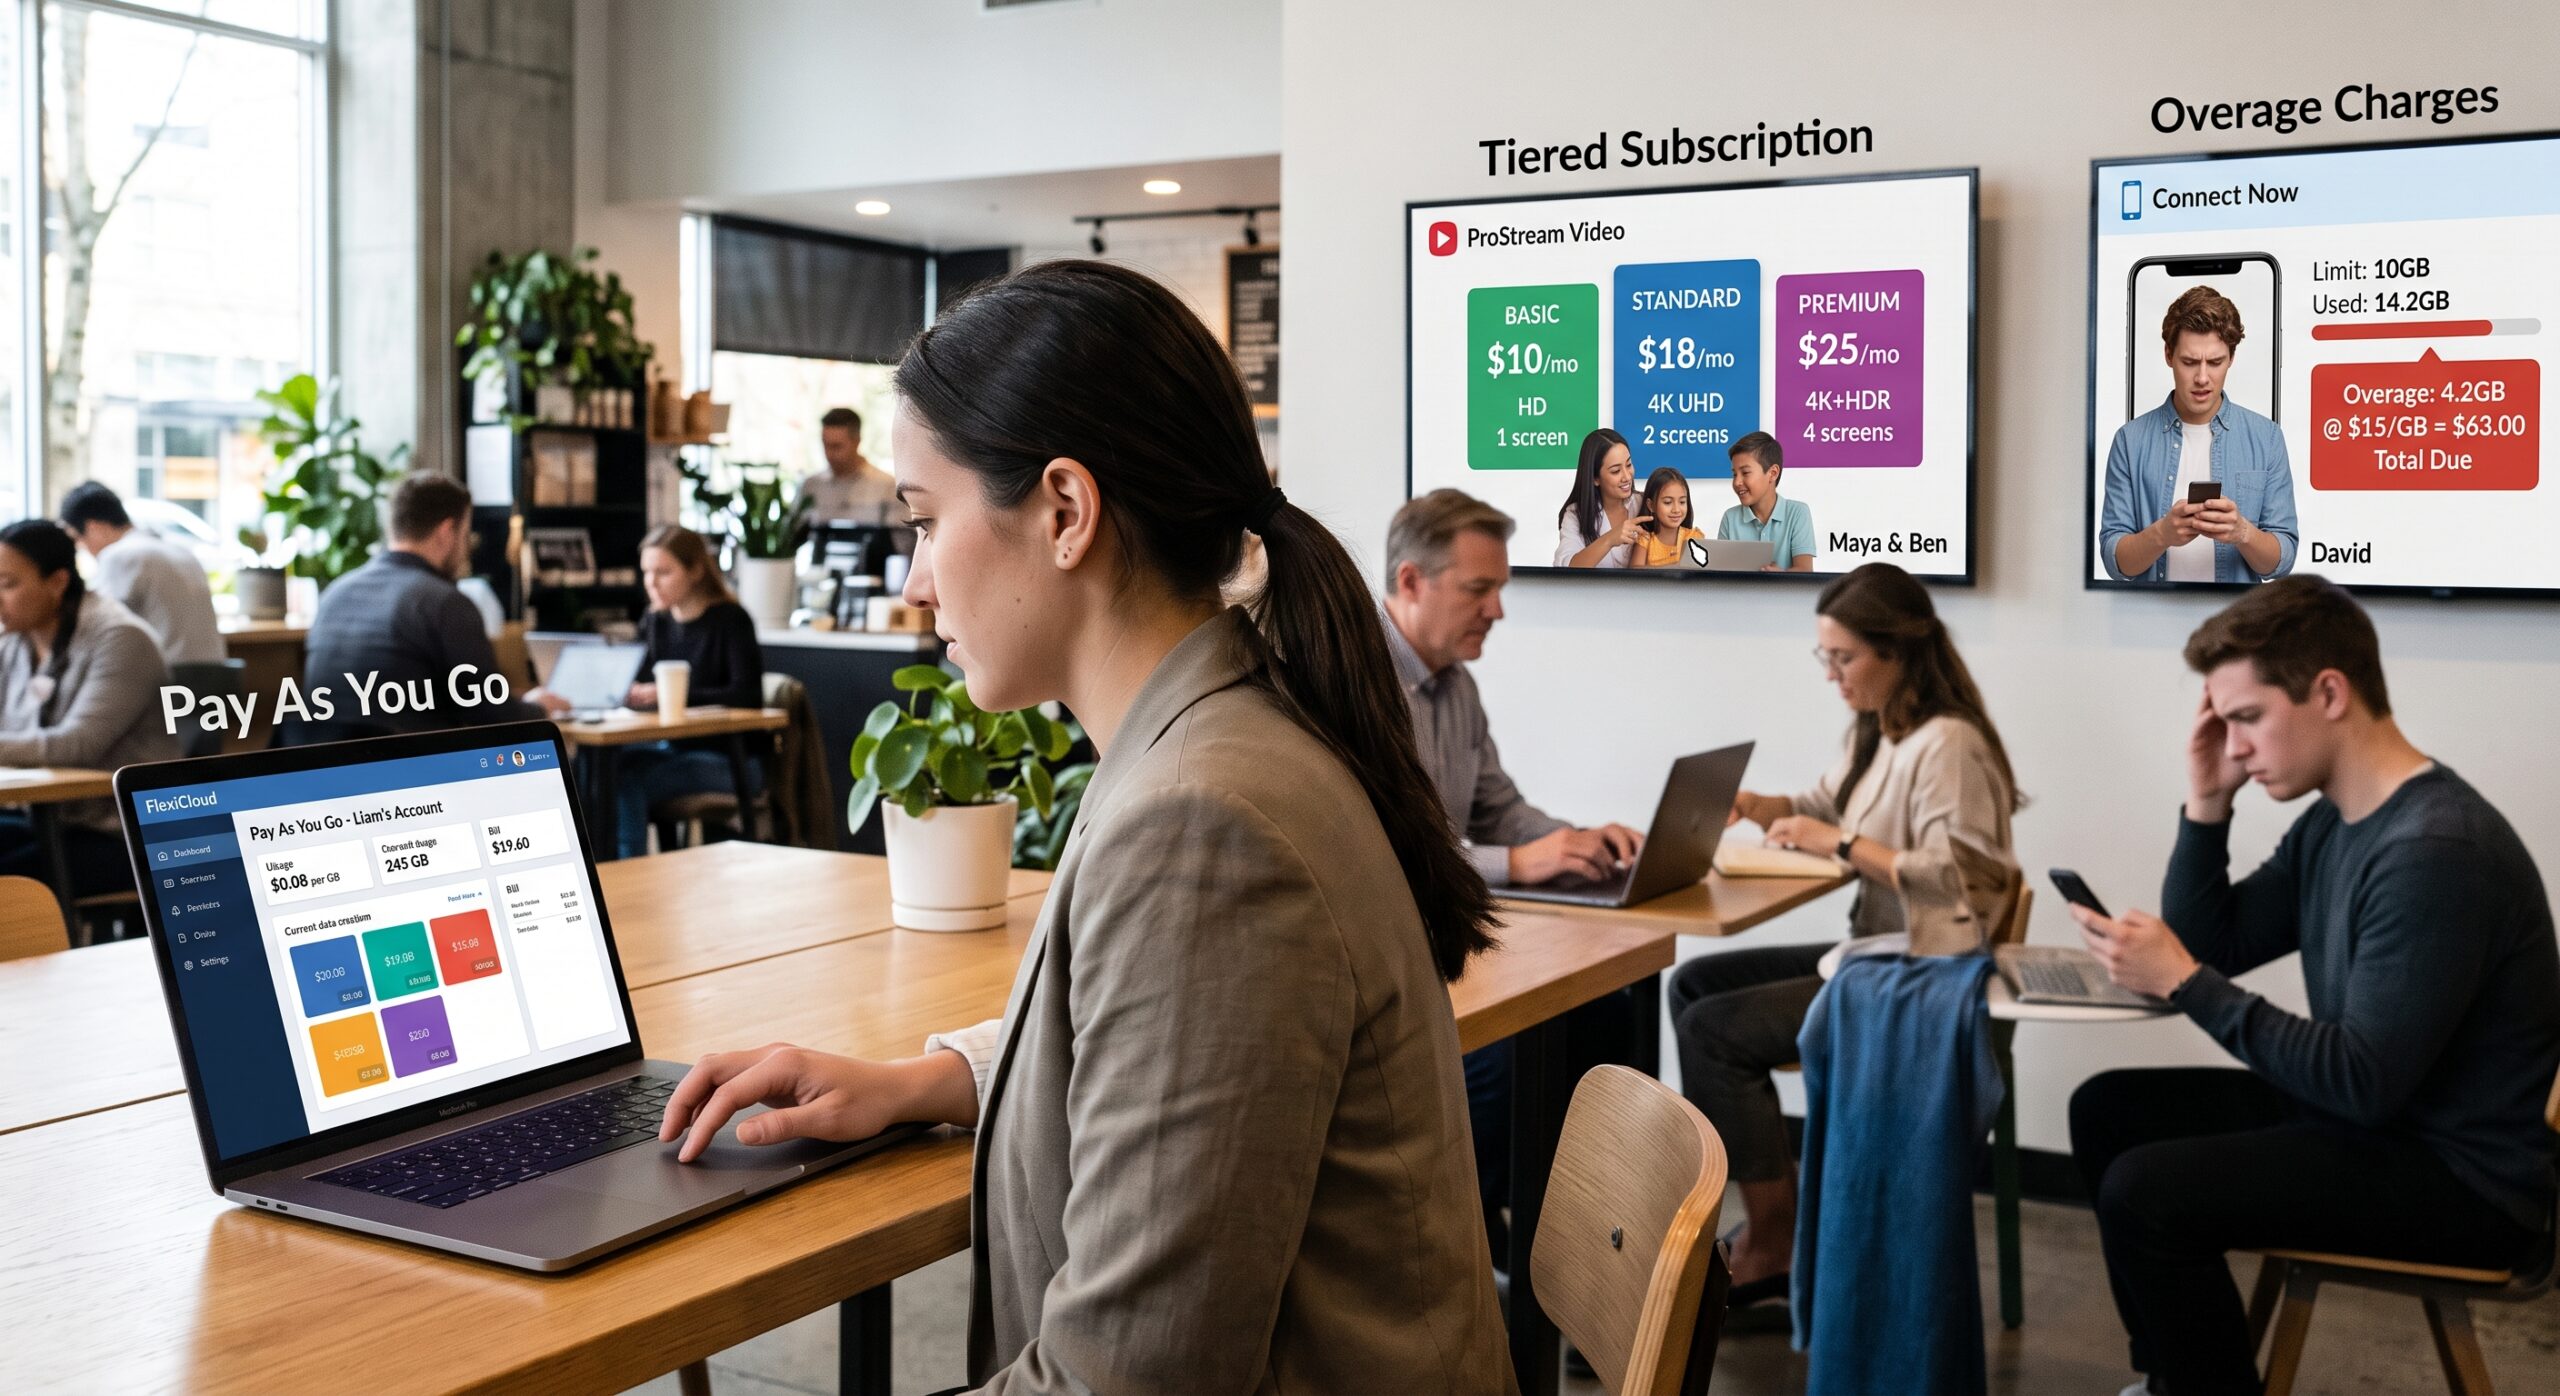
Subscription Pricing
Customers pay on a monthly or annual recurring basis. For instance, this model is common for SaaS platforms, monitoring services, and collaboration tools.
-
Advantages: Predictable budgeting, continuous updates, and lower upfront investment.
-
Potential Drawbacks: Costs continue indefinitely, and long-term spending can accumulate significantly.
Per-User Licensing
Organizations pay according to the number of active users. This is particularly suitable for:
-
Collaboration software
-
CRM platforms
-
Project management tools
In this model, benchmarking evaluates how quickly costs scale upwards as teams grow.
Usage-Based Pricing
Charges depend directly on actual consumption. Common examples include tracking:
-
API requests
-
Storage usage
-
Compute hours
-
Network traffic
To manage this model, performance engineers benchmark expected workloads in order to estimate future expenses accurately.
Enterprise Licensing
Large organizations negotiate custom, tailored pricing. Frequently, these enterprise agreements include:
-
Unlimited users and dedicated support
-
Professional training and custom services
-
Strict Service Level Agreements (SLAs)
Here, benchmarking ensures that the negotiated pricing aligns directly with expected performance and actual operational needs.
How to Build a Reliable Pricing Comparison Framework
One of the biggest mistakes companies make is comparing products without using a consistent evaluation process. Indeed, if each product is tested under different conditions, the results become completely unreliable.
Therefore, as a Benchmarking Engineer, I recommend using a structured framework that measures every solution against the exact same standards. By doing so, you create an apples-to-apples evaluation and reduce bias during purchasing decisions.
Step 1: Define Business Requirements
Before comparing products, identify exactly what the organization needs. Specifically, consider:
-
How many users will access the system simultaneously?
-
Additionally, what workloads will it handle daily?
-
Furthermore, what specific performance targets are required?
-
Moreover, is high availability strictly necessary?
-
Finally, what compliance standards must be met?
Without clear requirements, even accurate benchmarks can lead to poor purchasing decisions.
Step 2: Select Comparable Products
Choose solutions that solve the exact same business problem. For example, when evaluating monitoring platforms, compare products with similar tier capabilities instead of comparing an enterprise suite to an entry-level tool. This ensures the benchmarking results remain fair and meaningful.
Step 3: Standardize the Test Environment
Every product should be tested using identical conditions. In particular, this requires using the:
-
Same server specifications and operating system
-
Same network configuration
-
Same datasets and workloads
-
Same testing duration
Above all, consistency is the foundation of reliable technical benchmarking.
Step 4: Measure Performance Metrics
Collect objective data instead of relying on personal preferences. Key measurements include:
-
Response time and throughput
-
CPU utilization and memory usage
-
Storage consumption and network bandwidth
-
Error rate and recovery time
Together, these metrics provide measurable evidence that directly supports technical pricing comparisons.
Step 5: Calculate Operational Costs
Many expenses appear only after deployment. Because of this, engineers must explicitly estimate:
-
Cloud hosting and backup services
-
Storage growth and technical support
-
Maintenance labor and future infrastructure expansion
By including these costs, you produce a significantly more accurate Total Cost of Ownership.
Step 6: Score Each Product
Many organizations use a weighted scoring system to make final evaluations. For instance:
| Category | Weight |
| Performance | 30% |
| Price (TCO) | 20% |
| Reliability | 20% |
| Scalability | 15% |
| Support | 10% |
| Security | 5% |
Ultimately, the final combined score reflects both technical capability and overall financial value.
Real-World Example: Cloud Monitoring Platforms
Imagine an engineering team evaluating two cloud monitoring platforms under identical testing loads:
Product Alpha
-
Annual License: $18,000
-
CPU & Memory Usage: High
-
Average Response Time: 320 ms
-
Downtime per Year: 6 hours
Product Beta
-
Annual License: $24,000
-
CPU & Memory Usage: Low
-
Average Response Time: 170 ms
-
Downtime per Year: 1 hour
Initially, Product Alpha appears less expensive by $6,000 per year. However, comprehensive benchmarking reveals significant hidden costs for Product Alpha:
-
Extra cloud servers required to handle high resource usage
-
Higher electricity and compute consumption
-
Additional maintenance hours required from internal teams
-
Increased revenue loss due to longer annual downtime
Consequently, when these hidden costs are combined, they far exceed the initial difference in licensing fees. Thus, Product Beta delivers much better long-term value despite its higher sticker price.
Key Performance Metrics That Influence Pricing
Cost and performance are deeply interconnected. In this section, we examine the key technical metrics engineers monitor during benchmarking:
-
Response Time: Slow systems directly reduce productivity. Furthermore, faster systems often reduce labor costs and improve customer satisfaction.
-
Throughput: Measures how much work a system completes over time (e.g., transactions per second). Generally, higher throughput means fewer total servers are required.
-
CPU Utilization: Higher CPU usage increases compute costs. Therefore, lower CPU usage directly translates into lower cloud expenses.
-
Memory Consumption: Excessive memory demands force companies to buy larger virtual machines. Thus, tracking RAM usage helps forecast scaling expenses.
-
Storage Growth: Storage costs grow continuously over time. For this reason, tracking daily database growth helps estimate long-term operational expenses.
-
Network Usage: Bandwidth affects both user experience and monthly cloud bills. As a result, optimized network usage directly cuts cloud expenses.
-
Availability: Downtime carries direct financial consequences. Consequently, reliable systems minimize lost revenue and build user trust.
-
Scalability: Systems must maintain speed as demand expands. Hence, testing scalability ensures software won’t collapse or become drastically expensive as workloads grow.
Common Mistakes During Pricing Comparisons
Even experienced organizations sometimes make costly benchmarking mistakes. To protect your team, avoid the following pitfalls:
-
Comparing Price Instead of Value: The lowest-priced option often requires more maintenance and larger servers. Therefore, always evaluate the full financial picture.
-
Ignoring Future Growth: A solution supporting today’s workload may become unsustainable tomorrow. Hence, benchmark projected future workloads, not just current demand.
-
Relying on Vendor Marketing Instead of Testing: Marketing materials showcase only best-case scenarios. In contrast, independent benchmarking tests real-world performance under stress.
-
Overlooking Maintenance Costs: Ongoing maintenance is often a major hidden expense. As a rule, always budget for updates, patches, and administrative labor.
-
Skipping Scalability Tests: Some tools perform well under small tests but degrade rapidly under heavy loads. Thus, stress testing is essential.
-
Ignoring Integration Costs: Software rarely operates in total isolation. Consequently, budget for API development, data migration, and system integration.
-
Measuring Too Few Metrics: Price alone reveals very little. Instead, collect technical data across multiple categories to evaluate total value.
Best Practices for Accurate Benchmarking
Over the years, I’ve identified several best practices that consistently improve benchmarking quality:
-
Test Under Realistic Workloads: Synthetic tests rarely represent production environments. Therefore, use workloads that closely mirror actual daily operations.
-
Benchmark Multiple Times: Single test runs often contain anomalies. As a result, run several benchmark sessions and calculate averages for greater accuracy.
-
Include Business Stakeholders: Procurement, finance, and engineering teams each view pricing differently. Because of this, collaborative evaluations produce balanced decisions.
-
Document Every Assumption: Clearly explain test hardware, software versions, network settings, and workload characteristics. This ensures transparency and repeatability.
-
Review Pricing Regularly: Technology pricing changes frequently. Thus, reevaluate major investments regularly to ensure you continue receiving strong value.
Building a Benchmark Report That Decision-Makers Trust
The final benchmark report must present technical findings in a clear format that executives can easily digest. To achieve this, an effective report typically includes:
-
Executive summary and project objectives
-
Test environment setup and evaluation methodology
-
Performance metrics breakdown and cost analysis
-
Total Cost of Ownership estimates and risk assessment
-
Final data-backed recommendations
Pro Tip: Instead of recommending a product simply because it is faster or cheaper, explain how the measured results support strategic business goals—such as reducing operating expenses, improving uptime, or enabling long-term scaling.
Future Trends in Pricing Comparisons
Technical benchmarking has evolved significantly. Today, engineering teams use automated testing, advanced analytics, and financial modeling to evaluate tools. Looking ahead, several key trends are shaping the future of technical pricing comparisons:
-
AI-Assisted Benchmarking: Artificial intelligence can analyze thousands of benchmark results instantly. Consequently, engineers can rapidly spot resource waste, performance bottlenecks, and cost anomalies.
-
Real-Time Cost Monitoring: Rather than evaluating tools only before purchasing, teams now monitor post-deployment costs in real time. As a result, organizations can continuously optimize spending throughout the product lifecycle.
-
Cloud Cost Optimization: Modern evaluations focus heavily on price-to-performance metrics (such as cost per transaction or cost per user) rather than baseline subscription fees.
-
Sustainability as a Metric: Energy efficiency is increasingly becoming part of technical benchmarking. Indeed, solutions that reduce power consumption lower operational expenses while helping meet corporate environmental goals.
-
Automated Vendor Evaluation: Procurement workflows are integrating automated benchmarking tools in order to evaluate proposals, compliance, and performance metrics instantly.
Practical Checklist for Pricing Comparisons
Use this practical checklist before finalizing your next technology purchase:
-
[ ] Define precise business requirements before contacting vendors.
-
[ ] Test every candidate product under identical conditions.
-
[ ] Measure real performance instead of relying on marketing claims.
-
[ ] Calculate the complete Total Cost of Ownership (TCO).
-
[ ] Include required infrastructure and hosting expenses.
-
[ ] Estimate future scalability and growth costs.
-
[ ] Evaluate ongoing maintenance requirements and labor needs.
-
[ ] Review vendor support responsiveness and quality.
-
[ ] Measure system availability and historical reliability.
-
[ ] Document all testing assumptions, environments, and methods.
-
[ ] Repeat benchmarks across multiple runs to verify consistency.
-
[ ] Schedule periodic pricing reviews to adapt as needs evolve.
Final Thoughts
Throughout my experience as a Benchmarking Engineer, I’ve seen organizations save substantial time and money simply by looking beyond the initial purchase price.
In summary, effective technical pricing comparisons are not about finding the absolute cheapest option. Rather, they are about identifying the solution that delivers the strongest balance of performance, reliability, scalability, and long-term value.
Ultimately, a disciplined benchmarking process replaces wild assumptions with measurable evidence. As a result, it gives procurement teams confidence during negotiations, helps engineers select tools that fit operational needs, and provides executives with clarity regarding long-term financial impact. In the end, the best purchasing decision is rarely the one with the lowest initial price tag—it is the one that consistently delivers measurable value throughout its entire lifecycle.
Frequently Asked Questions (FAQ)
1. What are pricing comparisons in technical benchmarking?
Pricing comparisons evaluate multiple products or services by comparing their costs alongside measurable technical factors such as performance, scalability, maintenance, and infrastructure requirements. Ultimately, the goal is to identify the solution with the best long-term value rather than simply the lowest sticker price.
2. Why are technical pricing comparisons so important?
They prevent organizations from making bad investments based solely on initial costs. By considering ongoing operational expenses, support quality, and efficiency, technical pricing comparisons lead to smarter decisions and better resource allocation.
3. What is Total Cost of Ownership (TCO)?
Total Cost of Ownership includes every expense associated with a product throughout its operational life. Specifically, this includes purchase price, licensing, infrastructure, maintenance, training, downtime, support, and energy consumption. (Source: Gartner)
4. Which performance metrics matter most during pricing comparisons?
Benchmarking engineers commonly evaluate response time, throughput, CPU utilization, memory usage, storage growth, network bandwidth, availability, scalability, and recovery time. Together, these metrics reveal whether a higher-priced solution provides enough additional value to justify its cost.
5. How often should an organization perform pricing comparisons?
Formal pricing comparisons should occur before buying new tech, prior to renewing major contracts, during cloud migrations, before infrastructure upgrades, and at least annually during technology planning cycles. (Source: Gartner)
6. Do pricing comparisons apply only to software?
No, absolutely not. Pricing comparisons are equally valuable for evaluating cloud services, networking hardware, storage systems, industrial automation tools, managed IT services, and enterprise hardware.
7. What is the single biggest mistake during pricing comparisons?
The most common mistake is focusing exclusively on the initial purchase price while ignoring long-term operational costs. In fact, hidden expenses like maintenance, downtime, and server resources usually exceed the initial license fee over time.
8. How does benchmarking help during vendor negotiations?
Objective benchmark data provides leverage during pricing discussions. Instead of arguing over estimates, procurement teams can use standardized performance metrics to negotiate better pricing models and contract terms. (Source: VendorBenchmark)
References
-
Gartner (2024). Unlocking Value: Principles of Total Cost Ownership.
Available at: https://www.gartner.com/en/documents/5505795
-
Gartner (2024). Embed Total Cost of Ownership in Procurement Teams to Optimize Value.
Available at: https://www.gartner.com/en/documents/5177463
-
Gartner. IT Benchmarking and Budget Research.
Available at: https://www.gartner.com/en/information-technology
-
VendorBenchmark. Software Pricing Benchmarking Guide.
Available at: https://vendorbenchmark.com/
-
Rosati, P., Fowley, F., Pahl, C., Taibi, D., & Lynn, T. (2019). Right Scaling for Right Pricing: A Case Study on Total Cost of Ownership Measurement for Cloud Migration. Springer, Cham.
-
Tharwani, J., & Purkayastha, A. (2024). Cost-Performance Evaluation of General Compute Instances: AWS, Azure, GCP, and OCI. International Journal of Computer Trends and Technology (IJCTT).
Available at: https://www.ijcttjournal.org/archives/ijctt-v72i11p127
-
Dolan, E. D., & Moré, J. J. (2002). Benchmarking Optimization Software with Performance Profiles. Mathematical Programming / arXiv Repository.
Available at: https://arxiv.org/abs/cs/0102001