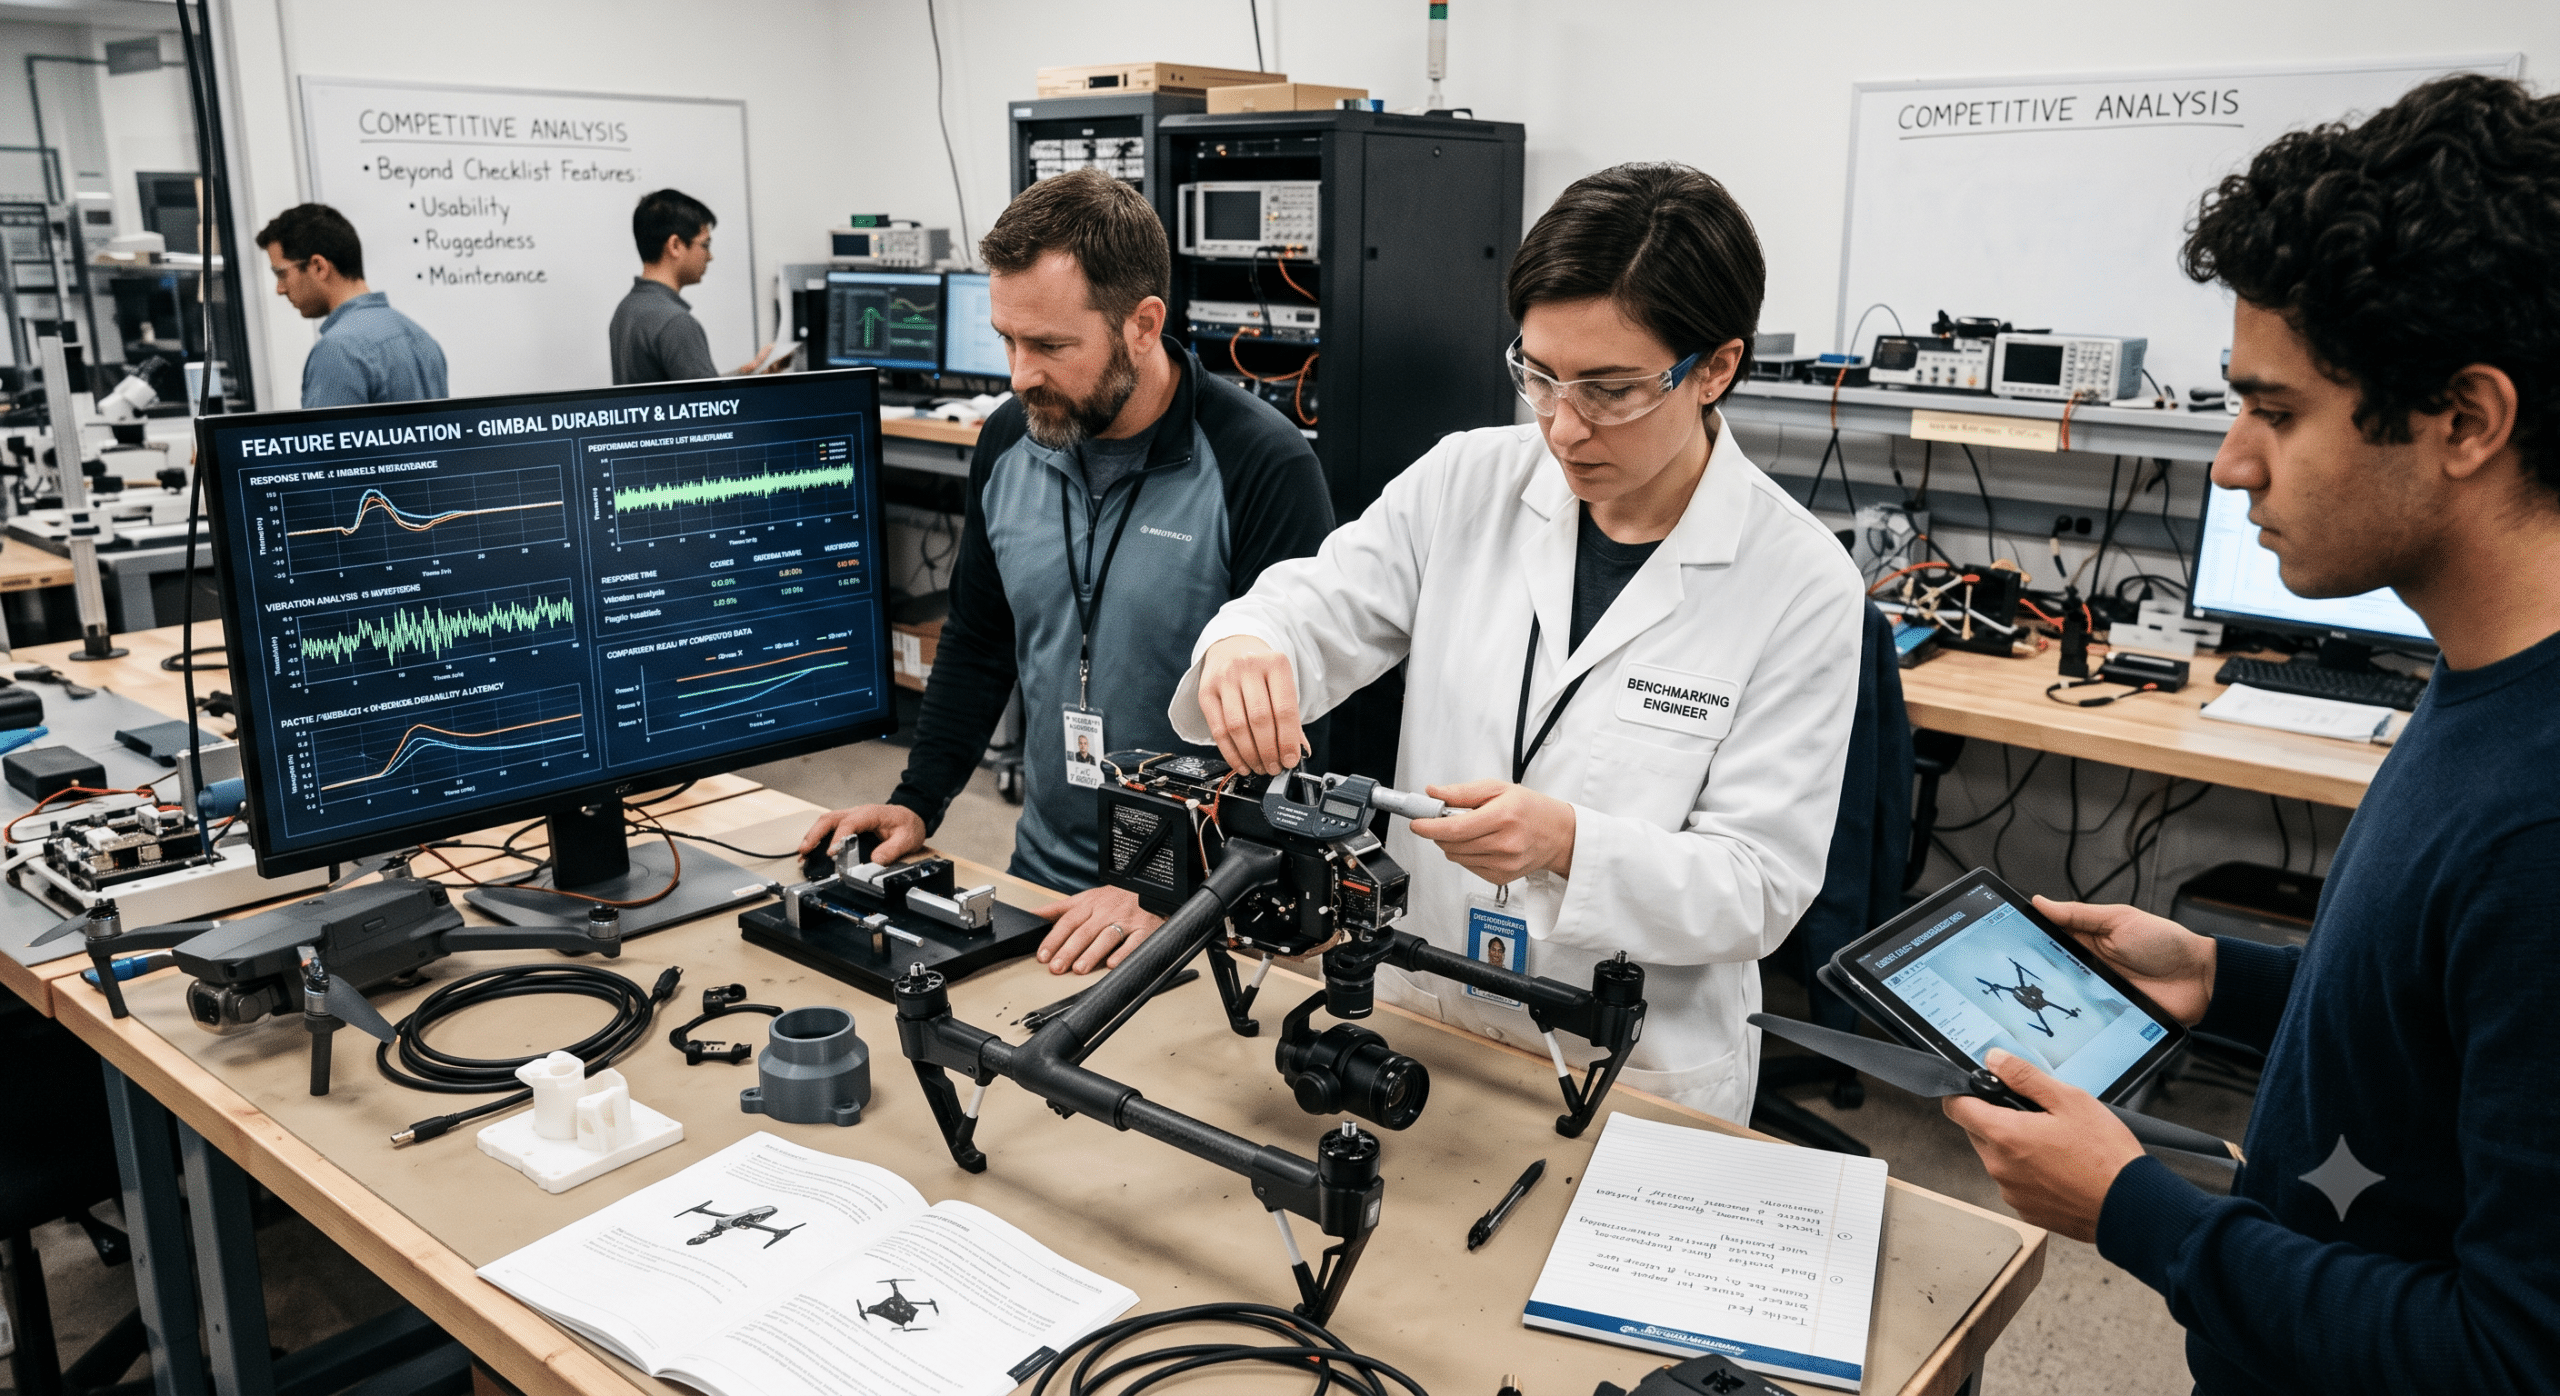
When people compare software, machines, or cloud platforms, performing a thorough feature analysis is often far more useful than relying on a simple checklist. For instance, one product has an extra dashboard. Meanwhile, another includes automation, and a third offers better reporting or stronger security. Consequently, at first glance, choosing the product with the longest feature list seems like the obvious answer.
However, as a Benchmarking Engineer, I’ve learned over time that this approach rarely leads to the best decision.
In reality, a long list of features does not always translate into better performance, lower operating costs, or happier users. To illustrate, some features look impressive during a product demonstration, yet they provide little value in everyday operations. On the other hand, others appear simple at first, furthermore saving hundreds of work hours over the life of a project.
Therefore, this is precisely where feature analysis becomes one of the most valuable tools in technical comparisons and benchmarking.
Specifically, feature analysis goes beyond asking, “Does this product have this feature?” Instead, it asks important engineering questions such as:
-
First, does the feature actually solve a business problem?
-
Second, how well does it perform under real workloads?
-
Additionally, is it reliable over time?
-
Moreover, is it easy for people to use?
-
Furthermore, does it justify its cost?
-
Ultimately, will it continue providing value as requirements grow?
As a result, these questions separate objective engineering decisions from marketing claims.
Throughout my career benchmarking enterprise software, cloud infrastructure, industrial automation systems, and performance monitoring tools, I’ve found that the best purchasing decisions come from structured evaluation—rather than opinions.
In this guide, I’ll explain step-by-step how engineers perform feature analysis, why it matters during benchmarking projects, along with the 9 practical evaluation areas that consistently produce better technical decisions.
What Is Feature Analysis?
Feature analysis is the process of evaluating how well individual product capabilities perform when compared against competing solutions or project requirements.
Thus, instead of merely counting features, engineers measure the quality, usefulness, reliability, efficiency, and long-term value of each capability.
For example, imagine two monitoring platforms.
Platform A advertises:
-
AI alerts
-
Custom dashboards
-
Mobile application
-
API integration
-
Automation workflows
Platform B advertises:
-
AI alerts
-
Dashboards
-
API
-
Automation
As a result, many buyers immediately assume Platform A is better simply because it includes more features.
Conversely, a benchmarking engineer looks deeper.
Consequently, crucial questions to consider include:
-
Which AI system detects problems faster?
-
Which dashboard loads more quickly?
-
Which API handles more requests under load?
-
Which automation engine scales better over time?
-
Finally, which product produces fewer false alarms?
In the end, those answers matter much more than the total number of features.
Why Feature Analysis Is More Important Than Ever
Technology changes rapidly. Furthermore, almost every vendor claims to offer:
-
Artificial Intelligence
-
Machine Learning
-
Automation
-
Cloud-native architecture
-
Real-time analytics
-
Predictive capabilities
-
Enterprise security
Because these terms appear on nearly every product page, the main challenge is determining whether those capabilities truly deliver measurable value.
In response, a structured feature analysis removes assumptions, subsequently replacing them with measurable comparisons.
Instead of asking:
“Which product sounds better?”
You ask:
“Which product performs better under identical conditions?”
Indeed, that small shift in perspective creates significantly better purchasing decisions.
Feature Analysis vs. Feature Lists
Many organizations still compare products using spreadsheets filled with checkmarks. For example:
| Feature | Product A | Product B |
| Dashboard | ✔ | ✔ |
| API | ✔ | ✔ |
| Reports | ✔ | ✔ |
| AI | ✔ | ✔ |
| Mobile | ✔ | ✖ |
At first glance, Product A wins. However, engineering benchmarking tells a completely different story.
Rather than relying on superficial checkmarks, a proper comparison systematically evaluates:
-
Performance and Speed
-
Stability and Scalability
-
Security and Maintenance
-
User experience
-
Reliability plus Cost efficiency
In fact, those measurements often reverse the final ranking. In particular, I’ve seen products with fewer features consistently outperform competitors simply because every capability was carefully designed and highly optimized.
The Purpose of Feature Analysis in Benchmarking
Benchmarking is fundamentally about measuring performance against defined standards or competing solutions. Accordingly, feature analysis supports benchmarking by helping engineers answer critical questions such as:
-
Which platform solves the problem more effectively?
-
In addition, which capability provides measurable business value?
-
Which features reduce manual work and improve productivity?
-
Which product delivers the highest return on investment?
-
Lastly, which features remain valuable over several years?
Therefore, instead of rewarding products with the longest marketing brochure, benchmarking rewards products that consistently perform well.
The 9 Areas Every Benchmarking Engineer Evaluates
After working on many comparison projects, I’ve found that nearly every feature can be evaluated using 9 important areas. Together, these areas create fair comparisons regardless of industry.
1. Functionality
To begin with, the first question is simple: Does the feature actually do what it promises?
Many products advertise impressive capabilities. Nevertheless, the real evaluation measures whether those capabilities perform correctly in everyday situations.
Key examples include:
-
Does automated backup actually recover data when needed?
-
Likewise, does predictive maintenance accurately detect failures?
-
Does report generation finish successfully under stress?
-
Furthermore, does workflow automation complete every step?
For this reason, a feature that works only part of the time should receive a lower score than a simpler feature that works consistently.
2. Performance
Next, performance measures speed and efficiency. Specifically, key questions include:
-
How fast does it load?
-
Similarly, how quickly does it process data?
-
Does response time stay consistent over time?
-
Moreover, does performance decline under heavier workloads?
Additionally, benchmarking often includes measuring key factors such as:
-
Response time
-
CPU usage and Memory consumption
-
Network utilization
-
Processing speed
Ultimately, without performance testing, feature comparisons remain fundamentally incomplete.
3. Reliability
A feature has little value if users cannot depend on it. Hence, reliability measures operational consistency over time.
Specifically, engineers observe:
-
Failure rates and Crash frequency
-
Recovery time during outages
-
Error handling capabilities
-
Operational stability
Above all, reliable systems reduce downtime and thereby improve customer confidence.
4. Ease of Use
Even advanced technology should remain easy to use. In contrast, complicated interfaces reduce overall productivity.
Therefore, good feature analysis examines:
-
The learning curve for new users
-
Navigation and Documentation
-
Setup time along with User satisfaction
In many cases, a simpler feature outperforms a more advanced one because employees actually use it.
5. Scalability
Many products perform well with small workloads. However, the real test comes during periods of growth.
Consequently, important questions include:
-
Can performance remain stable as user counts increase?
-
In addition, can the system process larger datasets seamlessly?
-
Will response time remain acceptable during traffic spikes?
-
Finally, can hardware expand easily?
As a result, scalability becomes especially crucial for cloud systems and enterprise software.
6. Integration
Modern systems rarely operate alone. Instead, they must connect with:
-
APIs and Databases
-
ERP systems plus CRM platforms
-
Monitoring tools and Security platforms
Thus, strong integration reduces manual work while simultaneously improving operational efficiency.
7. Security
Security should never be treated as an optional feature. Consequently, during benchmarking, engineers evaluate:
-
Authentication and Authorization
-
Encryption protocols
-
Audit logging mechanisms
-
Vulnerability management and Compliance support
In short, a product with slightly fewer features but stronger security often becomes the better long-term investment.
8. Maintainability
Every feature eventually requires updates. Accordingly, maintenance considerations include:
-
Software updates and Patch management
-
Configuration changes
-
Documentation quality plus Troubleshooting effort
In the long run, easy maintenance reduces operating costs significantly.
9. Business Value
Finally, this area often has the greatest impact. Every feature should answer one important question: Does it create measurable value?
For instance, value can manifest as:
-
Reduced operating costs and Faster workflows
-
Better customer experience plus Lower downtime
-
Increased productivity and Improved decision-making
-
Greater compliance along with Higher system availability
Therefore, a feature may be technically impressive, but if it provides little practical benefit, it should receive a lower priority during benchmarking.
Why Marketing Claims Should Never Replace Feature Analysis
One of the biggest mistakes I see is relying too heavily on vendor presentations.
To be fair, every product demonstration is designed to highlight strengths. Vendors naturally showcase ideal scenarios, polished interfaces, and carefully selected examples. While these demonstrations can be useful, they rarely reflect how a feature performs under real workloads, with real users, or in complex production environments.
In contrast, a benchmarking engineer approaches every claim with healthy curiosity rather than immediate acceptance. For instance, if a vendor says a feature is “AI-powered,” “real-time,” or “enterprise-grade,” the next step is to verify those claims specifically through testing, measurement, and comparison.
To illustrate further, two reporting tools may both advertise real-time dashboards. During benchmarking, however, one dashboard may refresh data every few seconds, whereas the other experiences noticeable delays when processing larger datasets. Although both products offer the same feature on paper, their performance is very different in practice.
This is precisely why feature analysis focuses on evidence instead of marketing language. Ultimately, objective testing provides the confidence needed to make decisions that will still make sense years after the purchase is complete.
Why Real-World Testing Matters
The best feature evaluations happen in environments that closely match actual business operations. Therefore, instead of relying only on product documentation, benchmarking teams should test features using:
-
Typical workloads
-
Real business data
-
Normal user activity
-
Peak usage conditions
-
Expected growth scenarios
Indeed, a feature that performs well in a demonstration may behave differently when hundreds or thousands of users access the system simultaneously. Hence, real-world testing helps uncover these differences before they become expensive operational problems.
In my experience, this practical approach has consistently led to more reliable benchmarking results and better technology investments.
Building a Practical Feature Analysis Framework
A good feature analysis does not happen by chance. Instead, it follows a repeatable process that allows different engineers to reach similar conclusions when evaluating the same products.
When I begin a benchmarking project, I avoid jumping directly into product comparisons. Rather, I build a framework that defines what success looks like before any testing starts.
Consequently, this approach reduces personal bias and thereby helps stakeholders understand why one solution scores higher than another.
Specifically, a structured framework usually includes:
-
Business objectives and Technical requirements
-
Performance targets plus Evaluation criteria
-
Testing procedures and Success measurements
-
Scoring methodology and Documentation standards
-
Finally, Final recommendations
By following these steps, every comparison remains fair and transparent.
Creating a Feature Evaluation Scorecard
One of the easiest ways to compare products is with a weighted scorecard. Rather than assigning every feature equal importance, you give more weight to the capabilities that matter most.
For example, if you’re selecting a cloud monitoring platform, uptime and alert accuracy may be much more important than dashboard themes.
A simple scorecard could look like this:
| Evaluation Area | Weight | Product A | Product B |
| Functionality | 20% | 9 | 8 |
| Performance | 20% | 8 | 9 |
| Reliability | 15% | 9 | 8 |
| Security | 15% | 9 | 9 |
| Ease of Use | 10% | 8 | 9 |
| Scalability | 10% | 9 | 8 |
| Integration | 5% | 8 | 9 |
| Maintainability | 3% | 8 | 8 |
| Business Value | 2% | 9 | 8 |
Overall, this approach provides a balanced view rather than rewarding the product with the most checkmarks.
Measuring Features with Real Metrics
Engineers trust numbers more than opinions. Therefore, whenever possible, evaluate features using measurable data.
Performance Metrics
-
Average response time and Maximum throughput
-
CPU utilization plus Memory usage
-
Storage efficiency and Network latency
Reliability Metrics
-
System uptime
-
Mean Time Between Failures (MTBF)
-
Mean Time to Recovery (MTTR)
-
Error rate and Failure percentage
User Experience Metrics
-
Time required for setup
-
Training hours needed
-
Number of support tickets
-
User satisfaction scores and Task completion time
Security Metrics
-
Number of detected vulnerabilities
-
Authentication methods and Encryption support
-
Audit logging capability plus Compliance certifications
As a result, these measurements remove guesswork from technical comparisons.
Looking Beyond Individual Features
One mistake many organizations make is evaluating each feature in isolation. In reality, features work together interdependently.
To illustrate:
An automation platform may have excellent scheduling, fast processing, and reliable notifications. However, if it cannot integrate with your ERP system, the overall value decreases significantly.
Likewise, a reporting tool may generate beautiful dashboards, but if it requires hours of manual data preparation every week, productivity suffers accordingly.
Thus, feature analysis should always consider how capabilities interact across the complete solution.
Comparing Features Across Different Platforms
Technical benchmarking becomes more challenging when comparing different technologies, such as:
-
Two cloud providers
-
Two industrial automation systems
-
Two cybersecurity platforms
-
Two analytics tools
In these cases, each vendor may describe similar features using different names:
| Vendor A | Vendor B |
| Smart Alerts | Intelligent Notifications |
| Workflow Automation | Process Automation |
| Analytics Dashboard | Insights Center |
| Data Connector | Integration Hub |
Although marketing names differ, engineering functionality may be nearly identical.
Therefore, during feature analysis, focus on what the capability actually accomplishes rather than what it is called.
Using Benchmark Scenarios
A good benchmark includes several testing scenarios instead of relying on a single demonstration.
Scenario 1: Normal Operations
Test features during everyday workloads. Specifically, ask:
-
Does everything perform as expected?
-
Furthermore, are users able to complete tasks quickly?
Scenario 2: Heavy Usage
Increase the workload in order to measure:
-
Response time and Resource consumption
-
Overall system stability
Scenario 3: Failure Recovery
Introduce controlled failures in order to observe:
-
Recovery speed and Error handling
-
Data protection plus Notification accuracy
Scenario 4: Growth Simulation
Simultaneously increase users, transactions, data volume, and connected devices so as to determine whether performance remains consistent.
Scenario 5: Long-Term Operation
Since some issues appear only after days or weeks, extended testing helps identify:
-
Memory leaks and Performance degradation
-
Resource exhaustion plus Stability problems
Together, these scenarios provide a much clearer picture than a short product demo.
Common KPIs Used in Feature Analysis
Benchmarking engineers rely on Key Performance Indicators (KPIs) to compare products objectively. The most critical KPIs include:
-
Speed: Response time, page load time, and transaction completion time.
-
Efficiency: CPU utilization, memory consumption, storage usage, plus network bandwidth.
-
Availability: Uptime percentage, downtime frequency, and service interruptions.
-
Quality: Error rate, accuracy, success rate, along with data consistency.
-
Productivity: Hours saved, tasks automated, and manual effort reduced.
-
Customer Experience: User satisfaction, support requests, feature adoption, plus retention rate.
Ultimately, selecting the right KPIs ensures that feature analysis aligns with both technical performance and business goals.
A Real-World Example: Comparing Monitoring Platforms
Imagine a manufacturing company evaluating two infrastructure monitoring platforms. At first glance, both products appear nearly identical because each offers dashboards, alerting, reporting, API integrations, and mobile access.
Without benchmarking, the purchasing team might simply choose the less expensive option. However, once the engineering team performs a detailed feature analysis, important differences emerge.
Platform A:
-
Faster dashboard loading
-
More accurate alert detection
-
Lower CPU usage
-
Better scalability
-
Easier integration with existing systems
Platform B:
-
More dashboard templates
-
Better visual customization
-
Lower licensing costs
-
Simpler initial setup
Although Platform B offers a better-looking interface, Platform A delivers stronger operational performance. Consequently, over several years, improved reliability and reduced downtime could easily outweigh the initial cost savings.
This example clearly illustrates why feature analysis should focus on measurable outcomes rather than appearance alone.
Balancing Technical Performance and Business Needs
One lesson I’ve learned over the years is that the technically superior feature is not always the best business choice.
For instance, an enterprise analytics platform might provide advanced predictive modeling, AI-assisted reporting, and dozens of customization options. While these capabilities are impressive, they may require extensive training, additional hardware, and higher licensing costs.
Conversely, a smaller organization with straightforward reporting needs may gain more value from a simpler platform that delivers reliable performance and requires minimal maintenance.
Therefore, feature analysis should answer two main questions:
-
How well does the feature perform?
-
Equally important, how valuable is the feature for the organization using it?
Ultimately, the best benchmarking projects balance both perspectives. Engineers provide the technical evidence, while business leaders consider budget, operational priorities, and long-term strategy.
Documenting Benchmark Results
After testing is complete, clear documentation is just as important as the measurements themselves. Specifically, a professional benchmarking report should include:
-
Objectives of the evaluation
-
Products or platforms compared
-
Testing environment and Evaluation criteria
-
Measured KPIs plus Scoring methodology
-
Strengths and weaknesses of each solution
-
Risks or limitations
-
Finally, Final recommendation
In doing so, well-documented results allow decision-makers to understand not only which product performed better, but also why it earned that conclusion.
Best Practices for Consistent Feature Analysis
To produce reliable benchmarking results, I recommend following these best practices:
-
Define evaluation criteria before testing begins.
-
Use identical test environments for every product.
-
Measure performance with repeatable workloads.
-
Prioritize objective metrics over marketing claims.
-
Weight features according to business importance.
-
Validate results specifically through multiple test runs.
-
Consider long-term maintenance and scalability.
-
Include both technical and business stakeholders in the review process.
-
Lastly, record every assumption, configuration, and test result for future reference.
By applying these practices, you can ensure that feature analysis remains consistent, transparent, and useful across different projects.
Advanced Feature Analysis Techniques Used by Benchmarking Engineers
As technology becomes more complex, basic comparisons are no longer enough. Instead, modern benchmarking projects require deeper analysis that examines not only whether a feature exists, but also how efficiently it performs under changing conditions.
For this reason, experienced benchmarking engineers often expand their evaluation using advanced techniques:
Load Testing
A feature may perform perfectly with ten users but struggle when thousands connect simultaneously. Thus, load testing measures concurrent users supported, transaction throughput, average response time, resource utilization, and system stability.
Stress Testing
Stress testing intentionally pushes systems beyond their expected limits in order to answer critical questions:
-
How does the feature fail?
-
Furthermore, can it recover automatically?
-
Is any data lost during a crash?
-
Lastly, how long does recovery take?
As a result, a product that fails gracefully is usually more valuable than one that crashes unexpectedly.
Scalability Testing
Since growth is inevitable for successful organizations, feature analysis should evaluate whether a solution can support more users, larger databases, higher transaction volumes, additional locations, and increased automation over time.
Compatibility Testing
Today’s technology environments include multiple operating systems, browsers, mobile devices, cloud platforms, and APIs. Therefore, compatibility testing evaluates whether features work consistently across different environments without introducing new issues.
The Growing Role of AI in Feature Analysis
Artificial intelligence is rapidly changing how engineers perform benchmarking. Specifically, instead of manually reviewing thousands of performance logs, AI-assisted tools can quickly identify patterns, detect anomalies, and summarize trends.
Key applications include:
-
Identifying performance bottlenecks
-
Detecting unusual response times
-
Predicting hardware failures
-
Recommending infrastructure improvements
-
Highlighting feature usage patterns
Despite these advantages, AI should support engineering judgment—not replace it. Therefore, experienced engineers must still validate results, interpret business context, and confirm findings through controlled testing.
Lessons Learned from Years of Benchmarking
After working on numerous technical comparison projects, several key lessons stand out:
-
First, never assume that the newest product is automatically the best. Although new releases often introduce exciting capabilities, mature solutions may provide greater stability and lower operational risk.
-
Second, avoid making decisions based solely on demonstrations. Vendors naturally present products under ideal conditions, whereas real-world workloads often reveal hidden limitations.
-
Third, involve multiple stakeholders in the evaluation process. Infrastructure engineers, security specialists, application owners, and end users each bring different perspectives, which produces more balanced decisions.
-
Finally, document everything. A well-organized benchmarking report creates transparency and subsequently makes it easier to repeat evaluations as products evolve.
Final Thoughts
Feature analysis is much more than comparing product specifications. Rather, it is a disciplined engineering process that measures how well individual capabilities perform, how reliably they operate, and how much value they create for an organization.
Throughout this guide, we’ve explored how benchmarking engineers move beyond feature checklists by evaluating functionality, performance, reliability, scalability, security, maintainability, integration, ease of use, and business value.
By using this structured approach, organizations can:
-
Make objective purchasing decisions
-
Reduce implementation risks
-
Improve operational performance
-
Increase return on investment
-
Support long-term growth
Technology will continue to evolve, yet the principles of sound benchmarking remain the same. Ultimately, decisions backed by measurable evidence consistently outperform decisions based on assumptions or marketing claims.
Whether you’re comparing enterprise software, industrial automation platforms, cloud services, or monitoring tools, a thorough feature analysis will help you identify the solution that best aligns with your technical requirements and business goals.
Frequently Asked Questions (FAQ)
1. What is feature analysis?
Feature analysis is the structured process of evaluating and comparing product capabilities based on functionality, performance, reliability, usability, security, scalability, and business value—rather than simply counting available features.
2. Why is feature analysis important in benchmarking?
It helps organizations make objective decisions using measurable data instead of relying on marketing materials or personal opinions. Ultimately, effective benchmarking identifies which solution performs best under real operating conditions.
3. How is feature analysis different from feature comparison?
A feature comparison simply checks whether a capability exists, whereas feature analysis evaluates how well that capability performs, how reliable it is, and whether it provides measurable value.
4. Which industries benefit from feature analysis?
Almost every industry can benefit, including:
-
Software development
-
Cloud computing
-
Manufacturing & Industrial automation
-
Healthcare & Finance
-
Telecommunications & Cybersecurity
-
Retail technology
5. What metrics are commonly used during feature analysis?
Common metrics include response time, throughput, CPU utilization, memory usage, uptime, error rate, recovery time, user satisfaction, cost savings, and productivity improvements.
6. What tools can help perform feature analysis?
Popular tools include JMeter, Grafana, Prometheus, Apache Benchmark, LoadRunner, k6, New Relic, Dynatrace, and Azure Load Testing. However, the specific choice depends on the type of system being evaluated and the required performance metrics.
7. How often should organizations perform feature analysis?
Organizations should conduct feature analysis whenever they are:
-
Purchasing new technology
-
Upgrading existing platforms
-
Comparing vendors
-
Planning infrastructure expansion
-
Performing annual technology reviews
-
Measuring continuous improvement initiatives
8. Can small businesses benefit from feature analysis?
Absolutely. Small businesses often have tighter budgets, making it even more important to choose solutions that deliver the best balance of performance, cost, and long-term value.
9. What is the biggest mistake during feature analysis?
The most common mistake is assuming that the product with the most features is automatically the best choice. Instead, successful benchmarking focuses on measurable performance, reliability, usability, and business outcomes rather than the length of a feature list.
Conclusion
Successful technical comparisons are built on evidence, not assumptions. In conclusion, a thoughtful feature analysis helps organizations understand the true strengths and limitations of competing solutions, thereby ensuring that investments support both current operational needs and future growth. By following a consistent benchmarking methodology and measuring what truly matters, engineering teams can confidently recommend technologies that deliver lasting performance and business value.
References
- American Society for Quality (ASQ) What is Benchmarking? Quality Resources & Case Studies
- American Productivity & Quality Center (APQC) Benchmarking Fundamentals & Open Standards Benchmarking (OSB®)
- Bartz-Beielstein, T., et al. (2020) Benchmarking in Optimization: Best Practice and Open Issues
- Hasselbring, W. (2021) Benchmarking as Empirical Standard in Software Engineering Research